FINANCIAL PLANNING - SAMPLES

All information is for Demo Use Only
Please do not replicate in any form without written consent of owner

  *** Company Valuation / Net Present Value of Cash Flows Sample
1
  IC Broker, Inc. PRODUCTION FUNCTION ANALYSIS (CAPITAL VALUATION)      
Feb-02 Cash Flow NPV   0.2 Discount Rate (cost of borrowing)  
        Market rate = investments of a simular nature
  Year Free Cash Flow NPV at 20% discount   Factored in is companies expected cost  
1 97,278 $77,822   of capital (i.e., the interest rate on an acquisition loan)
2 818,109 $654,487   and the expected inflation rate    
3 1,538,940 $1,231,152            
4 2,259,771 $1,807,817            
5 2,980,602 $2,384,481            
    $6,155,759 * Present value of 5-year cash flow    
Residual value* of 14,903,008 $4,406,309.56 * Company's perpetuity earnings value    
business at 5 years:     (IRR - Computed Internal Rate of Return)    
                 
    $1,749,449.72 Total present value of company      
                 
                 
  *Note: the residual value was computed by taking the fifth year's            
projected value and dividing by the discount rate: $108,000/.20 = $540,000.            


Discounted cash flows method              
Take the estimated cash flow from the last year forecast            
Assume that level of cash flow will continue indefinitely into the future            
                 
                 
Result = Determined the residual value              
that the company will have after the five years of projected statements            
                 
* Conservative prediction does not include post five year growth            


  *** Investment Outlay / Return on Investment (ROI) Sample
2
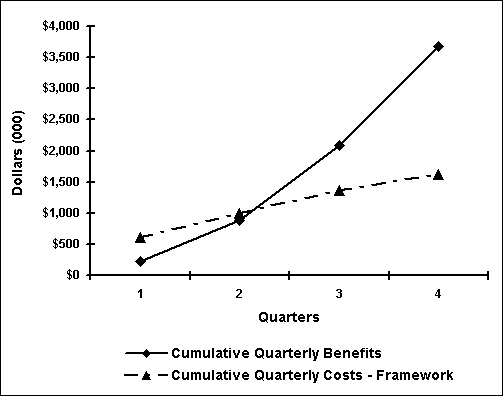
When Will This Investment Pay for Itself?    
* All Projects all Steps Summary (Discounted at 10% Cost of Capital)    
Benefits Q1 Q2 Q3 Q4 Totals
Increased Profit          
   CRM  Sales / Marketing 160 416 608 800 1984
   OPS Procurement / Forecast   8 16 40 64
   SCM  Mfg. / Procurement $40 62 120 142 364
   SCM  Mfg. / Marketing     80 160 240
   Reduced Costs          
   CRM  Sales / Marketing 10 75 225 250 560
   OPS Procurement / Forecast 15 50 70 90 225
   SCM  Mfg. / Procurement     10 20 30
   SCM  Mfg. / Marketing   50 70 90 210
TOTAL BENEFITS 225 661 1199 1592  
TOTAL CUMULATIVE BENEFITS 225 886 2085 3677  
         
Costs          
  Hardware 90 10 50 25 175
  Software 105 45 60 25 235
  Services 420 280 205 100 1005
  Maintenance   40 65 105 210
TOTAL COST 615 375 380 255  
TOTAL CUMULATIVE COSTS 615 990 1370 1625  
CUMULATIVE NET RETURN -390 -104 715 2052  
         
First Year Net Return 2,052        
Payback Qtr. 3        
Return 156%        


  *** Investment Assessment - Relative to Net Present Value (NPV) & Internal Rate of Return (IRR) Sample
3
Cost of capital 10%            
             
  Year 0 1 3 4 5
             
Project A   Cash flow    (10,000)     20,000      
  PV factor 100% 91%      
  PV of cash flow    (10,000)     18,182      
  NPV      8,182        
  IRR 100%        
             
Project B-A   Cash flow    (10,000)     15,000      
  PV factor 100% 91%      
  PV of cash flow    (10,000)     13,636      
  NPV      3,636        
  IRR 50%        
             
Project B has a positive NPV relative to A (on an incremental basis) so should be taken.


  *** Cost Benefit Analysis - Training Sample
4
SW Public Training Cost/Benefit Analysis                
                     
Cost of SW Public Training     Learning SW without Training      
                     
Number of Training days 2.0   *Number of Learning days 12.5      
Tuition     $899.00   Tuition     0.00      
Travel     $800.00   Travel     0.00      
Meals & Lodging   $380.00   Meals & Lodging   0.00      
Salary     $416.67   Salary     $2,604.17      
Benefits     $137.50   Benefits     $859.38      
Replacement   $416.67   Replacement   $2,604.17      
                     
Total     $3,049.83   Total     $6,067.71      
                     
                     
Return on Investment = $3,049.83 (Cost of SW public training) divided by        
    $6,067.71 (Cost of learning SW without training)        
                     
Results: SW Training costs 50% less than learning SW without training.        
Conversely, it is 2.0 times more expensive to learn SW on your own instead of taking SW training.  
                     
                     
Key: Tuition:   Most two-day SW courses are priced at $899.          
      Most three-day SW courses are priced at $1,199.          
  Travel:   Typical business travel costs $800, including airfare and ground transportation.    
  Meals/Lodging: Hotel calculated at $150/day. Food calculated at $40/day.        
  Salary:   $50,000 base salary divided by 240 working days per year times the number of training days.  
  Benefits:   Benefits based on $50,000 base salary x 33% x the number of training days.      
  Replacement: Cost of replacing employees or lost productivity time.        
                       
                       
  *Independent research confirms that it takes the average employee 100 hours (12.5 days) to learn a typical desktop software program.


  *** Combined P&L Sample
5