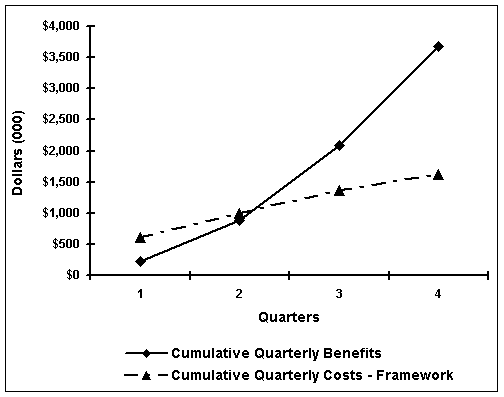
* All Projects all Steps Summary (Discounted at 10% Cost of Capital)
| Benefits | Q1 | Q2 | Q3 | Q4 | Totals |
| Increased Profit | |||||
| CRM Sales / Marketing | 160 | 416 | 608 | 800 | 1984 |
| OPS Procurement / Forecast | 8 | 16 | 40 | 64 | |
| SCM Mfg. / Procurement | $40 | 62 | 120 | 142 | 364 |
| SCM Mfg. / Marketing | 80 | 160 | 240 | ||
| Reduced Costs | |||||
| CRM Sales / Marketing | 10 | 75 | 225 | 250 | 560 |
| OPS Procurement / Forecast | 15 | 50 | 70 | 90 | 225 |
| SCM Mfg. / Procurement | 10 | 20 | 30 | ||
| SCM Mfg. / Marketing | 50 | 70 | 90 | 210 | |
| TOTAL BENEFITS | 225 | 661 | 1199 | 1592 | |
| TOTAL CUMULATIVE BENEFITS | 225 | 886 | 2085 | 3677 | |
| Costs | |||||
| Hardware | 90 | 10 | 50 | 25 | 175 |
| Software | 105 | 45 | 60 | 25 | 235 |
| Services | 420 | 280 | 205 | 100 | 1005 |
| Maintenance | 40 | 65 | 105 | 210 | |
| TOTAL COST | 615 | 375 | 380 | 255 | |
| TOTAL CUMULATIVE COSTS | 615 | 990 | 1370 | 1625 | |
| CUMULATIVE NET RETURN | -390 | -104 | 715 | 2052 | |
| First Year Net Return | 2,052 | ||||
| Payback | Qtr. 3 | ||||
| Return | 156% |
